1. Getting Started
This section provides a comprehensive guide to installing and setting up the MemSysExplorer Application Profiler, the top layer of the MemSysExplorer framework.
The profiler is designed to extract detailed memory access patterns and performance metrics from real applications, enabling subsequent analysis and modeling of memory technologies such as DRAM, HBM, and NVM. It supports a variety of workloads across both CPU and GPU platforms, and acts as the entry point for generating structured profiling data for downstream memory simulation and evaluation.
The overall profiling workflow is shown in Figure 1, which includes three categories of supported profilers:
Architecture-Independent Profilers Tools like DynamoRIO that use dynamic binary instrumentation (DBI) to analyze memory behavior independent of specific hardware.
Architecture-Dependent Profilers Tools such as Perf and NVIDIA Nsight Compute, which use hardware performance counters to collect platform-specific metrics.
Architectural Simulators Tools like Sniper Simulator, which model the entire memory hierarchy to provide cycle-level timing and bandwidth evaluation.
Important
MemSysExplorer GitHub Repository
Explore the codebase, raise issues, or contribute at: https://github.com/duca181/MemSysExplorer/tree/apps_dev/apps
To learn more about license terms and third-party attribution, refer to the 6. Licensing and Attribution page.
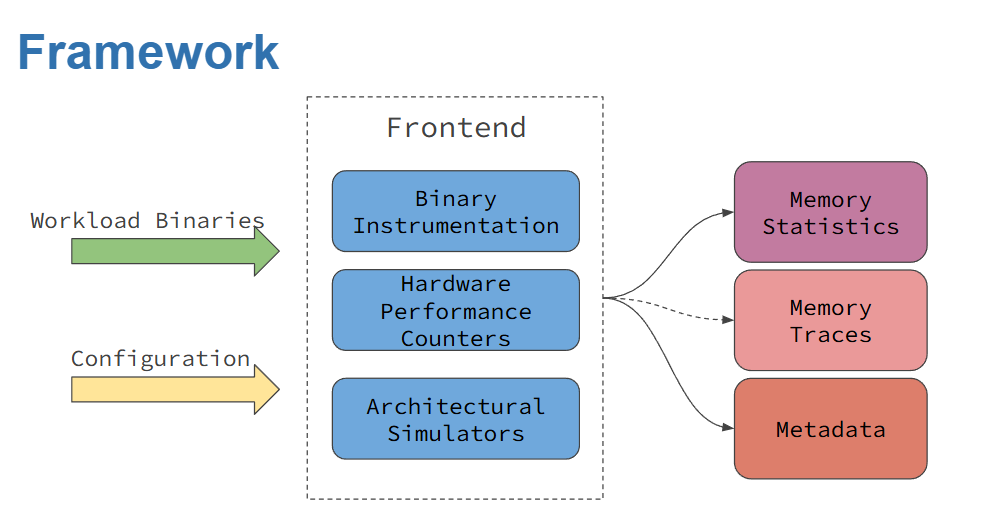
Figure 1: MemSysExplorer Application Profiling Framework
1.1 Supported Profilers
The following profilers are available in MemSysExplorer. Each has a dedicated directory in the GitHub repository. Refer to the linked folders for implementation details and advanced usage examples:
DynamoRIO — Dynamic binary instrumentation for CPU DynamoRIO Source Code
Perf — Linux hardware performance counters Perf Source Code
Sniper — Architectural simulator for multicore systems Sniper Source Code
NVBit — GPU binary instrumentation for CUDA applications NVbit Source Code
Nsight Compute (NCU) — NVIDIA tool for GPU memory statistics Nsight Compute Source Code
Note
GPU frontends such as nvbit and ncu should only be used with GPU workloads. Attempting to profile CPU binaries with these tools may result in undefined behavior or runtime errors.
1.2 Prerequisites
To run the MemSysExplorer Application Profiler, the following software dependencies must be installed:
CUDA: Version 10.x or higher
CUDA Toolkit: Version 10.x or higher
Python 3: Version 3.x or higher
DynamoRIO: Latest version
GCC: Latest version
For profilers that rely on Hardware Performance Counters (HPC)—such as Perf and NVIDIA Nsight Compute—additional system configuration is required.
Specifically, you must enable access to performance counters at the system level to allow these tools to capture low-level memory statistics. On Linux systems, this often involves modifying /proc/sys/kernel/perf_event_paranoid or applying appropriate capabilities using setcap or sudo privileges.
To enable performance counters on NVIDIA GPUs, please follow the instructions provided at the following link:
1.3 Installing the Repository
To get started with MemSysExplorer, begin by cloning the repository from GitHub. This repository contains the full source code for the application profiler, including frontend tools, example workloads, and configuration scripts.
git clone -b apps_dev https://github.com/duca181/MemSysExplorer.git
cd MemSysExplorer/apps
The repository includes a top-level Makefile that supports building and configuring five available profilers:
dynamorio
nvbit
sniper
perf
nsight
Important
While the provided Makefile simplifies the build process, some dependencies must be installed manually using system package managers such as apt (e.g., sudo apt install <library>). Please refer to the 6. Licensing and Attribution page or the official documentation for each tool to ensure you have installed the required development libraries and runtime dependencies before building the profilers in MemSysExplorer.
Note
Before building any of the profilers, you must first set up the environment using the setup/setup.sh (for bash) or setup/setup.csh (for tcsh). This ensures all compiler paths, libraries, and dependencies are correctly configured.
Among these, the following tools require compilation or setup:
dynamorio – Build the custom DynamoRIO-based instrumentation frontend.
nvbit – Build the NVBit-based GPU binary instrumentation layer.
sniper – Compile and configure the Sniper architectural simulator.
The remaining two frontends rely on system-level availability:
perf – Ensure Linux perf is installed and accessible via your system’s performance counters (check perf_event_paranoid settings if needed).
ncu – Requires the NVIDIA Nsight Compute CLI and proper GPU driver installation.
To build any tool:
make <profiler-name>
Example:
make dynamorio
To build all tools:
make
Profiler Registration with `built_profilers.json`
When you run a make command for any supported profiler, the built_profilers.json file is automatically created and updated to mark that profiler as active.
Example:
{
  "dynamorio": true,
  "nvbit": true,
  "sniper": true,
  "perf": true,
  "ncu": true
}
You may manually set any value to `false` to temporarily disable a profiler without deleting its build.
1.4 Setting Up the Environment
MemSysExplorer provides shell-specific setup scripts to configure all the required environment variables for each supported frontend profiler. These scripts are located in the setup/ directory and ensure correct paths to toolchains, compilers, libraries, and runtime dependencies.
Each frontend has its own set of environment variables that must be initialized to function correctly. Use the setup.sh (for bash/sh) or setup.csh (for tcsh/csh) script to configure them automatically.
Setup Options:
1 or dynamorio — Setup for CPU instrumentation using DynamoRIO
2 or cuda — Setup for GPU profiling using NVBit and Nsight Compute
3 or sniper — Setup for CPU simulation using Sniper
Configured Environment Variables:
DynamoRIO Frontend GCC_PATH, PATH, LD_LIBRARY_PATH, LIBRARY_PATH, C_INCLUDE_PATH, CPLUS_INCLUDE_PATH
CUDA Frontends (NVBit and Nsight Compute) CUDA_HOME, PATH, LD_LIBRARY_PATH, NCU_HOME, NCU_PARSING, PYTHONPATH
Sniper Frontend SNIPER_ROOT, PIN_HOME, PATH, LD_LIBRARY_PATH, C_INCLUDE_PATH, CPLUS_INCLUDE_PATH, LD_RUN_PATH (optional)
These scripts eliminate the need to configure the environment manually and ensure all compiler and runtime paths are set consistently.
Example (tcsh):
source setup/setup.csh dynamorio
Example (bash):
source setup/setup.sh cuda
1.5 Example Usage
The MemSysExplorer profiling tool can be executed using the following general command:
python3 main.py --profiler <profiler_name> --action <action> --level <memory-level> --executable /path/to/your/executable
Main Flags:
-p, –profiler — Profiler backend: dynamorio, perf, sniper, nvbit, ncu
-a, –action — Action: profiling, extract_metrics, both
–level — Memory level: l1, l2, l3, dram
–config — Optional config file for profilers like sniper, ncu
–ncores — Number of cores (used with sniper)
–executable — Path to the application binary to profile
Profiler-Specific Examples:
DynamoRIO
python3 main.py --profiler dynamorio --action profiling --executable /path/to/your/executable
Linux Perf
python3 main.py --profiler perf --action profiling --level l3 --executable /path/to/your/executable
Sniper Simulator
python3 main.py --profiler sniper --action both --level dram \
  --results_dir /path/to/your/output --config config/skylake.cfg --executable /path/to/your/executable
NVBit
python3 main.py --profiler nvbit --action profiling --executable /path/to/your/executable
Nsight Compute (NCU)
python3 main.py --profiler ncu --action profiling --level l1 \
  --config config/ncu_template.json --executable /path/to/your/executable
1.6 Output Samples
Each profiler in the MemSysExplorer framework produces output traces based on its internal capabilities. Despite differences in instrumentation mechanisms, all profilers conform to a shared output schema designed for downstream memory analysis.
Two key output files are generated during each profiling session:
Memory Statistics Trace
This JSON file captures the high-level memory activity observed during the execution.
File Name Format: A unique identifier (_<id>) is automatically appended if a file with the same name already exists to avoid overwriting.
memsyspatternconfig_<workload>.json
memsyspatternconfig_<workload>_<id>.json  (if duplicate exists)
Example:
{
  "exp_name": "DynamoRIOProfilers",
  "benchmark_name": " ",
  "read_freq": 0.6861362992349107,
  "total_reads": 135597,
  "write_freq": 0.31386370076508924,
  "total_writes": 62027,
  "read_size": 32,
  "write_size": 32,
  "total_writes_i": 1,
  "total_writes_d": 1,
  "total_reads_d": 1,
  "total_reads_i": 1,
  "workingset_size": 1369868,
  "metadata": null,
  "unit": {
    "read_freq": "bytes/s",
    "write_freq": "bytes/s",
    "total_reads": "count",
    "total_writes": "count",
    "read_size": "bytes",
    "write_size": "bytes",
    "workingset_size": "bytes"
  }
}
Workload Metadata Object
This file records the software/hardware context of the profiling session and captures system architecture, CPU/GPU info, OS, and toolchain metadata.
File Name Format: As with pattern configs, a unique identifier is appended on conflict:
memsysmetadata_<profiler_name>.json
memsysmetadata_<profiler_name>_<id>.json  (if duplicate exists)
Example:
{
  "gpu_name": "NVIDIA GeForce RTX 4080 SUPER",
  "driver_version": "560.94",
  "gpu_memory_MB": 16376,
  "cpu_info": {
    "Architecture": "x86_64",
    "CPU op-mode(s)": "32-bit, 64-bit",
    "Address sizes": "39 bits physical, 48 bits virtual",
    "Model name": "Intel(R) Core(TM) i7-14700KF",
    "L3 cache": "33 MiB (1 instance)"
  },
  "cpu_cache": {
    "L1d": "48K",
    "L1i": "32K",
    "L2": "2048K",
    "L3": "33792K"
  },
  "dram_size_MB": 15848,
  "software_info": {
    "OS": "Linux 5.15.167.4-microsoft-standard-WSL2",
    "Kernel": "5.15.167.4-microsoft-standard-WSL2",
    "gcc_version": "gcc (Ubuntu 11.4.0) 11.4.0",
    "FileSystem": "ext4"
  },
  "dynamorio_version": "11.3.0"
}
These are the two core output traces produced by all profilers in the MemSysExplorer framework:
memsyspatternconfig_<workload>.json— memory statistics tracememsyspatternconfig_<workload>_<id>.json— trace file with a counter to avoid overwritesmemsysmetadata_<profiler_name>.json— system and environment metadatamemsysmetadata_<profiler_name>_<id>.json— metadata file with a counter if needed
For additional profiler-specific outputs, refer to the respective sections under 3. Profilers.
To parse and analyze these output files, see the 4. Tools documentation for utilities like trace_parser.py, timeseries_parser.py, and visualization tools.
1.7 Profiler-Specific Configurations
Each profiler may require additional specific arguments. Refer to the Profilers section for detailed information on the necessary flags and options for each profiler.
By following these steps, you can effectively profile your applications and gain valuable insights into memory usage patterns.
This framework supports a variety of workloads across both CPU and GPU platforms, and acts as the entry point for generating structured profiling data for downstream simulation.
To learn more about license terms and third-party attribution, refer to the 6. Licensing and Attribution page.